❓ Help (Help Assistant)
The Help menu is your central starting point to efficiently learn how to use the InfoRapid KnowledgeBase Builder. Since the software offers an enormous wealth of functions for highly complex knowledge management, you will find reference materials for power users as well as interactive tours for beginners here.
ℹ️ Information & Resources
In this upper section, you will find static help options and links to external documentation that will help you master the software.
- About KnowledgeBase Builder: Opens an information window with details about the currently installed version of the software, copyright information, and the licenses of the open-source libraries used. You will also find contact information for developer support here.
- Keyboard Shortcuts: A must for power users! Opens an overview of all available keyboard shortcuts. Anyone who internalizes the keyboard shortcuts can build diagrams and mind maps much faster and more fluidly without constantly having to open the menus. The ? key opens the same overview.
- Watch our video tutorials on YouTube: Redirects you directly to the official YouTube playlist of the app. There you will find clear, step-by-step video instructions on specific topics (such as importing Wikipedia articles, text analysis, or creating complex 3D layouts).
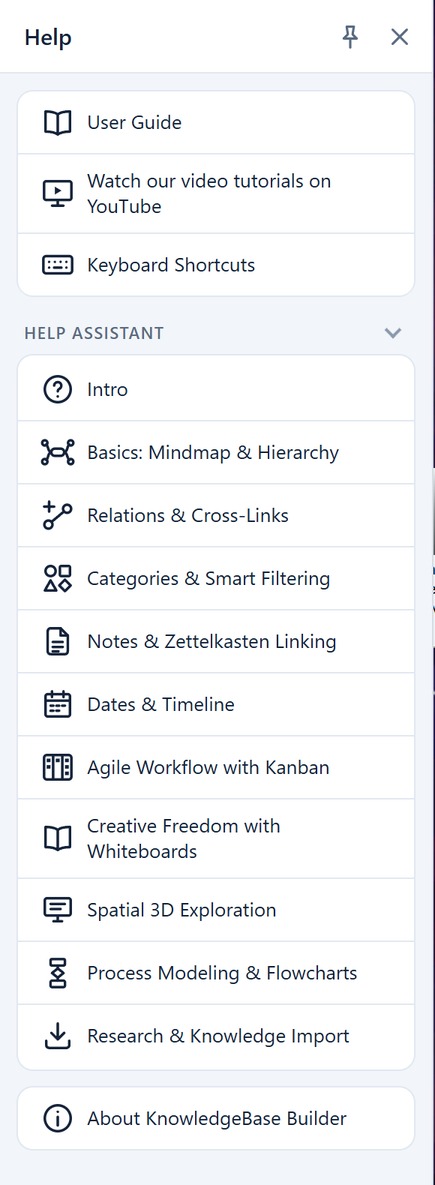
🤖 Help Assistant (Interactive Learning)
Under this tab you will find the guided tours. A tour does not only explain a function, it demonstrates it live on your screen - and the explanation stays on screen while it does: a small card in the bottom right corner shows the first sentence of each step while the demonstration runs in the middle of the screen, and a speech bubble points at the control the step is about. The bubble disappears by itself after a few seconds, so it does not keep covering anything. Read more unfolds the full text and pauses the tour, so you can read at your own pace.
The tours are built around a unified, realistic model ("SmartCampus Innovation Hub") combining project phases, scheduled tasks, status fields, cross-relations, and color-coded disciplines. All specialized tours automatically clean up after themselves via undo (cleanup: true), leaving your personal database completely untouched.
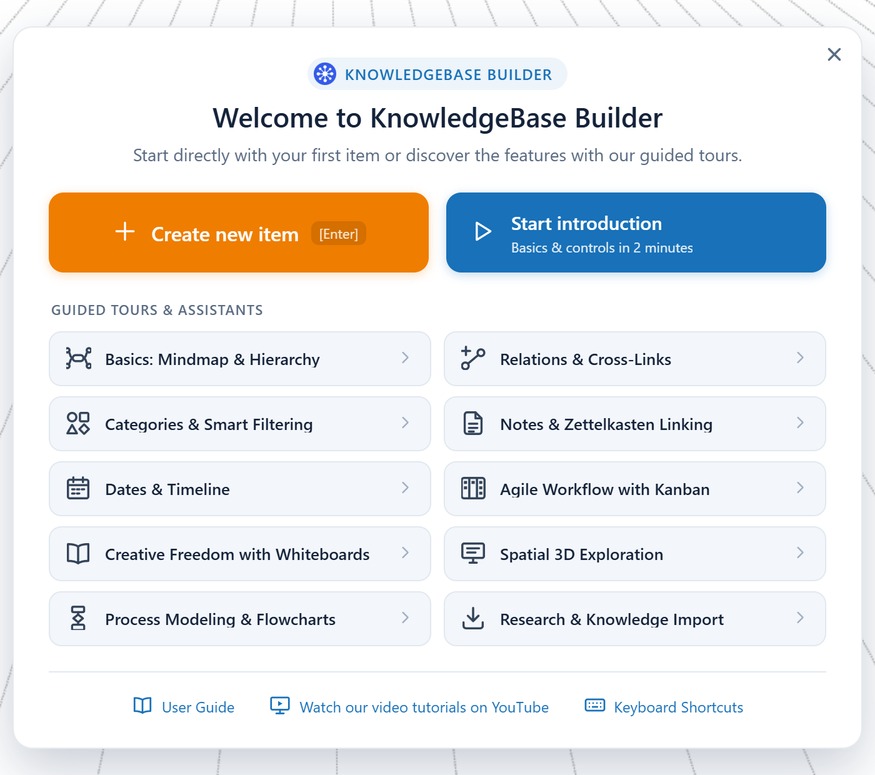
- Introduction to KnowledgeBase Builder: A fast-paced, 12-step guided tour through all core capabilities: outline import with milestones and scheduled tasks, automated radial mindmap layout, creating elements, dynamic root focus and browsing history, search by name, timeline scheduling, rich HTML notes, cross-links, and both the spatial 3D view and the table view. The sample project holds around 40 elements across six disciplines — enough for the spatial view to show what it can do.
- Basics: Mindmap & Hierarchy: Twelve steps on building a hierarchy: the root item and its anchor circle, levels counted from the root, child items by dialog, keyboard (Ctrl+Shift+K, Ctrl+K) and drag gesture, moving a branch by dragging the end of its relation, the same hierarchy as a flowchart and a radial mind map, limiting the number of visible levels, root switch and back.
- Relations & Cross-Links: Ten steps from tree to network. To keep lines and labels clear, the tour collapses the items, hides the data fields and chooses “Mind Map radial (straight lines)”. Then: create a cross-link by dragging, the relation toolbar with Edit and Delete, labels for the forward and backward direction in the dialog, a data flow between two branches, color, line style and width of a single relation, hiding and showing cross-links. Changing the root via the Permitting Process to the foundation and then to the permit shows the same line read from both directions – “Dependent on” and “Prerequisite for” – and afterwards the back button returns step by step to the starting point.
- Categories & Smart Filtering: Eleven steps on the second order next to the hierarchy. The tour shows the category labels, changes the category of an item (the color follows, the place in the tree stays), turns a whole category yellow with black text through a single item and assigns the tag “Critical Path”. The Items in Category panel lists first a category, then all items carrying the tag; in the 3D view, clicking an entry flies the camera to three items of the category in turn. Finally the Item Category Filter hides a category and isolates the critical path with “Show Only Selected”. Filter and category labels are restored when the tour ends.
- Notes & Zettelkasten Linking: Twelve steps on how diagram and notes work together. The notes panel shows the formatted HTML note of the selected element and follows every selection via SYNC; names of elements in the diagram appear highlighted in the note, and hovering or clicking shows their description. The tour writes a new note, turns a selected word into an
itemid://link to another element via Edit → 'Insert Hyperlink', saves it, creates a child element from a term via Actions → 'Create new item' (the sentence becomes its description), and follows the link – with 'Always Load Target' the target becomes the new root. - Dates & Timeline: Twelve steps on dates in the knowledge network. The tour shows the timeline through the calendar icon (it counts elements with dates across the whole database), explains bars for periods, diamonds for due dates, the category colors and the red today line, and enlarges the strip through the '+2' overflow until every entry fits. Plus, minus and 'Today' control the period; select an element in the diagram and the strip moves to it and marks it in gold, while a click in the strip loads the element as the new root. From the start, start, end and status appear as data fields in the cards (the descriptions stay collapsed); the tour shows where 'Show Data Fields' sits. On the Dates tab of the dialog, an element gets a due date from the calendar and high priority – and then appears in the strip as a bar and a diamond. Finally the tour moves a date directly in the timeline and extends it at the edge. It restores the strip's height and visibility at the end.
- Agile Workflow with Kanban: Twelve steps on a SmartCampus sprint whose tasks carry their state as a category (To Do, In Progress, Done) and their team as a tag; the tour turns on the category labels for this. The “Kanban / Matrix” switch in the More Tools panel turns the mind map into a board: the root item is the heading, the categories are columns with a card count. In the column catalog “(none)” goes and the empty category “Review” comes in; using the bar above its header, its grip moves it in front of “Done”. The team tags become swimlanes – a matrix the tour fits into the window with the zoom if needed. Cards move by dragging into another column or into another lane at the same time (category and tag change), “Show Rank” numbers them, a double-click in a cell creates a card with its attributes, and “Hand Over Cards…” moves all unfinished work to the board “Sprint 2”. The tour restores layout, zoom and category labels at the end.
- Creative Freedom with Whiteboards: Twelve steps between mind map and whiteboard, using a small mind map for the grand opening. “Turn this diagram into a whiteboard” in the Tools panel makes it a whiteboard, and every card keeps its position from the mind map. “New whiteboard” creates a second, empty whiteboard, and the pencil in the whiteboard bar gives it a name. One card appears by double-click where you click, a second one via the “New card” button in the middle of the view; dragged by the four-arrow handle below it, it moves next to the first one and no other card moves. The round crosshair handle connects two cards without a dialog. The cross shows the same whiteboard as a mind map – the connection becomes a level –, “Show as whiteboard” puts every card back in its place, and the “Whiteboards” section switches between both whiteboards. When you finish, the tour removes the sample and the whiteboards.
- Spatial 3D Exploration: Twelve steps in space, using the large SmartCampus example from the introduction (42 items in six areas) – only at this size does the network gain depth; the tour collapses descriptions and data fields. The 3D button shows the root large in the middle, the other items spread out in depth. The demo pointer rotates the camera with the left mouse button, zooms with the wheel and pans with the right button. “Adjust View → Diagram → Layout” offers five spatial layouts; the tour picks the tree (level-wise). “Rotate” makes the camera circle, and “Stop” then takes the place of “Rotate” and “VR”; the button with the four corners restores the starting view. A click on a card shows a tooltip with its description, a second click makes it the root; in 3D the search flies the camera to the hit without changing the root. Back in the diagram, the root chosen in 3D still applies. The tour restores the view and removes the example at the end.
- Process Modeling & Flowcharts: Twelve steps from text to process. The tour writes a commissioning process as pseudocode into the “Insert Pseudocode” dialog (Edit Diagram → Insert), and the app draws the flowchart from it – left to right, with the first line as the root. The shapes show what a step does: a hexagon for the loop (while), a diamond for the decision (if), a triangle for the call, a circle for function and return. If and else produce a green Yes and a red No edge that join again after the block; the loop leads back to the check via “Continue” and out via “End”; call connects the call to its function with a dotted edge. Comments after // appear as descriptions with “Expand Items”, and the whole source text is kept as a note on the first item. Finally the tour adds a step by hand and switches to “Flowchart (top -> bottom)”. When you finish, it removes the example.
- Research & Knowledge Import: Eleven steps (nine without the Wikipedia import) on the ways knowledge gets into your database, using photovoltaics as the example. Bullet points in the dialog “Insert Outlined Text” become a mind map: dash = item, indentation = level, text in parentheses = description,
name:: [[target]]= labeled cross-link,category::= category. A copied paragraph goes into the note of Solar cells; with Actions → “Create new items automatically” every selected term becomes a child item, the sentence around it its description. If the Wikipedia import is available (always in the apps, switched off in the online version), the item toolbar fetches an article: one item with image and link, the whole text with section headings as its note, your item names highlighted in it. A CSV table (Knowledge Base → Import / Export) adds module types – items with the same category and name are found again instead of duplicated. Finally “Export JSON Data” shows the preview without saving a file. When it ends, the tour takes everything back and restores language code and number of results of the Wikipedia dialog.
The control bar
While a tour is running, a bar sits at the bottom of the screen – on the right of the timeline header while the timeline is shown, so that it covers no entries:
| Button | What it does |
|---|---|
| Back | Page back one step and read it again. The diagram is not rewound - no step is ever carried out twice. |
| Pause / Continue | Stops the tour and resumes it. It stops at the next action boundary, so a movement that has started still finishes. |
| Next | Straight to the next step. While a step is running, the button is disabled. |
| Speed | Switches the playback speed: 75 %, 100 %, 150 %, 200 %. |
| End | Ends the tour. The Esc key does the same. |
Hands-on steps
Some steps are for you to try yourself. The card turns orange, the application can be operated again, and the tour waits - as long as you like - until you click Continue in the card.
💡 Pro Tip: Undoing the Intro
Many users are surprised that after playing the Intro, a finished example diagram suddenly appears in their own project. Don't worry, your data has not been overwritten!
The program simply records the assistant's steps in your current view. You can remove the created example diagram completely and without a trace with a single click: Simply go to the Edit Diagram menu and click on the entry "Help Assistant" at the very top under Undo. All nodes and lines generated by the assistant will be immediately deleted from your database.